
成熟的日志解决方案,那就是ELK,还有现在比较火的Loki,(当然还有很多其他解决方案,比如Splunk、Datadog等),那我们这个小网站,小体量,必然是选择Loki来做。
所以这次就采用Nginx+Promtail+Loki+Grafana来做一个简单的Nginx日志展示。
Nginx的安装不多说,Promtail和Loki都选用二进制的方式进行安装,直接下载对应版本的二进制文件,解压后指定配置文件启动即可。
其中promtail配置文件如下配置:
server:http_listen_port: 9080grpc_listen_port: 0positions:filename: /tmp/positions.yamlclients:url: http://localhost:3100/loki/api/v1/pushscrape_configs:job_name: nginxpipeline_stages:replace:expression: '(?:[0-9]{1,3}\.){3}([0-9]{1,3})'replace: '***'static_configs:targets:localhostlabels:job: nginx_access_loghost: expatsxxxxsagent: promtail__path__: /var/log/nginx/expatshxxxxs.access.log
日志收集工作完成后,在Nginx中,需要修改日志格式,修改Nginx的日志格式为Json格式,配置如下:
log_format json_analytics escape=json '{''"msec": "$msec", ' # request unixtime in seconds with a milliseconds resolution'"connection": "$connection", ' # connection serial number'"connection_requests": "$connection_requests", ' # number of requests made in connection'"pid": "$pid", ' # process pid'"request_id": "$request_id", ' # the unique request id'"request_length": "$request_length", ' # request length (including headers and body)'"remote_addr": "$remote_addr", ' # client IP'"remote_user": "$remote_user", ' # client HTTP username'"remote_port": "$remote_port", ' # client port'"time_local": "$time_local", ''"time_iso8601": "$time_iso8601", ' # local time in the ISO 8601 standard format'"request": "$request", ' # full path no arguments if the request'"request_uri": "$request_uri", ' # full path and arguments if the request'"args": "$args", ' # args'"status": "$status", ' # response status code'"body_bytes_sent": "$body_bytes_sent", ' # the number of body bytes exclude headers sent to a client'"bytes_sent": "$bytes_sent", ' # the number of bytes sent to a client'"http_referer": "$http_referer", ' # HTTP referer'"http_user_agent": "$http_user_agent", ' # user agent'"http_x_forwarded_for": "$http_x_forwarded_for", ' # http_x_forwarded_for'"http_host": "$http_host", ' # the request Host: header'"server_name": "$server_name", ' # the name of the vhost serving the request'"request_time": "$request_time", ' # request processing time in seconds with msec resolution'"upstream": "$upstream_addr", ' # upstream backend server for proxied requests'"upstream_connect_time": "$upstream_connect_time", ' # upstream handshake time incl. TLS'"upstream_header_time": "$upstream_header_time", ' # time spent receiving upstream headers'"upstream_response_time": "$upstream_response_time", ' # time spend receiving upstream body'"upstream_response_length": "$upstream_response_length", ' # upstream response length'"upstream_cache_status": "$upstream_cache_status", ' # cache HIT/MISS where applicable'"ssl_protocol": "$ssl_protocol", ' # TLS protocol'"ssl_cipher": "$ssl_cipher", ' # TLS cipher'"scheme": "$scheme", ' # http or https'"request_method": "$request_method", ' # request method'"server_protocol": "$server_protocol", ' # request protocol, like HTTP/1.1 or HTTP/2.0'"pipe": "$pipe", ' # "p" if request was pipelined, "." otherwise'"gzip_ratio": "$gzip_ratio", ''"http_cf_ray": "$http_cf_ray",''"geoip_country_code": "$geoip_country_code"''}';
配置文件中,需要注意的是geoip的配置,需要在nginx中添加geoip模块。
首先通过yum安装geoip及lib库:
yum -y install GeoIP GeoIP-data GeoIP-devel
之后,重新编译Nginx,通过--with-http_geoip_module添加nginx的geoip模块。
编译完成后,在objs目录下生成新的Nginx可执行文件,替换原先的,通过kill -USR2信号,升级Nginx。
此时配置的log_format不会再报错geoip指令找不到,配置完成后,配置网站的access日志,引用刚才配置的json格式的log_format。
查看此时的日志格式:
{"msec": "1633430998.322", "connection": "4", "connection_requests": "1", "pid": "29887", "request_id": "40770fec38c2e5a68714df5f7a67283d", "request_length": "392", "remote_addr": "106.19.96.55", "remote_user": "", "remote_port": "43746", "time_local": "05/Oct/2021:18:49:58 +0800", "time_iso8601": "2021-10-05T18:49:58+08:00", "request": "GET / HTTP/2.0", "request_uri": "/", "args": "", "status": "200", "body_bytes_sent": "60949", "bytes_sent": "61222", "http_referer": "https://cn.bing.com/search?q=expat+tourism+agent+in+china&go=Search&qs=n&form=QBRE&sp=-1&pq=expat+tourism+agent+in+chi&sc=0-26&sk=&cvid=8BD2D4B79B3A4FA682571CB5BC7334D4", "http_user_agent": "Mozilla/5.0 (iPhone; CPU iPhone OS 13_6 like Mac OS X) AppleWebKit/605.1.15 (KHTML, like Gecko) Version/13.1.2 Mobile/15E148 Safari/604.1", "http_x_forwarded_for": "", "http_host": "www.expatsholidays.com", "server_name": "www.expatsholidays.com", "request_time": "0.003", "upstream": "127.0.0.1:9000", "upstream_connect_time": "0.000", "upstream_header_time": "0.002", "upstream_response_time": "0.002", "upstream_response_length": "60991", "upstream_cache_status": "", "ssl_protocol": "TLSv1.2", "ssl_cipher": "ECDHE-RSA-AES128-GCM-SHA256", "scheme": "https", "request_method": "GET", "server_protocol": "HTTP/2.0", "pipe": ".", "gzip_ratio": "", "http_cf_ray": "","geoip_country_code": ""}{"msec": "1633430998.709", "connection": "4", "connection_requests": "2", "pid": "29887", "request_id": "430fd53a457ea580c47e9b055da2b4d0", "request_length": "56", "remote_addr": "106.19.96.55", "remote_user": "", "remote_port": "43746", "time_local": "05/Oct/2021:18:49:58 +0800", "time_iso8601": "2021-10-05T18:49:58+08:00", "request": "GET /maps/api/js?ver=5.6.1 HTTP/2.0", "request_uri": "/maps/api/js?ver=5.6.1", "args": "ver=5.6.1", "status": "200", "body_bytes_sent": "41262", "bytes_sent": "41406", "http_referer": "https://www.expatsholidays.com/", "http_user_agent": "Mozilla/5.0 (iPhone; CPU iPhone OS 13_6 like Mac OS X) AppleWebKit/605.1.15 (KHTML, like Gecko) Version/13.1.2 Mobile/15E148 Safari/604.1", "http_x_forwarded_for": "", "http_host": "www.expatsholidays.com", "server_name": "www.expatsholidays.com", "request_time": "0.000", "upstream": "", "upstream_connect_time": "", "upstream_header_time": "", "upstream_response_time": "", "upstream_response_length": "", "upstream_cache_status": "", "ssl_protocol": "TLSv1.2", "ssl_cipher": "ECDHE-RSA-AES128-GCM-SHA256", "scheme": "https", "request_method": "GET", "server_protocol": "HTTP/2.0", "pipe": ".", "gzip_ratio": "3.06", "http_cf_ray": "","geoip_country_code": ""}
已经转为JSON格式,接着安装grafana,最快捷的方式,通过docker直接起一个:
docker run -d -p 3000:3000 grafana/grafana
启动后,通过admin/admin默认用户名密码登录,登陆后提示重置密码,之后进入grafana界面。
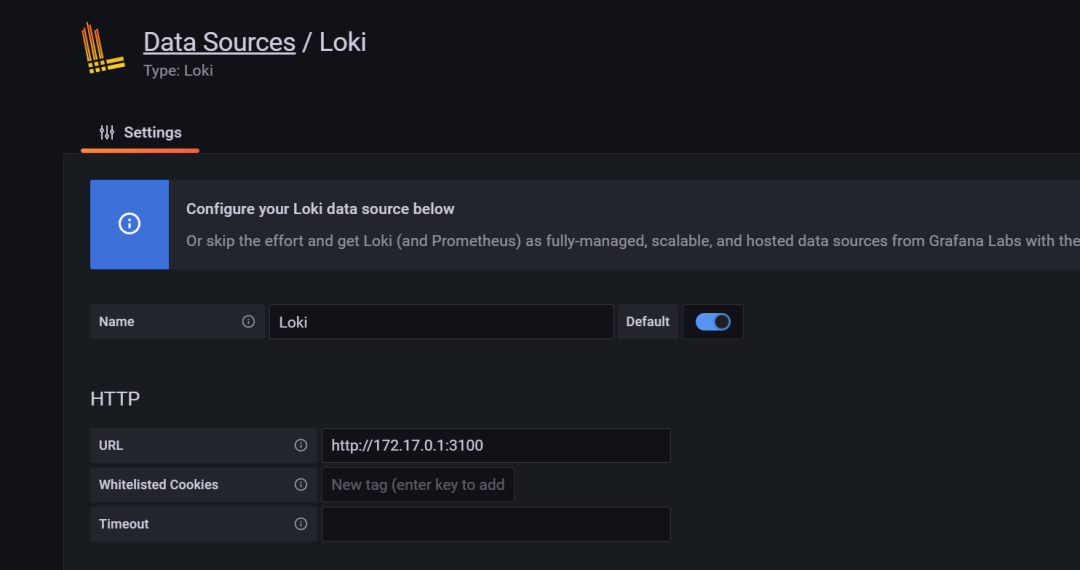
我们直接添加数据源loki:
先通过explore查询,日志是否存入loki。
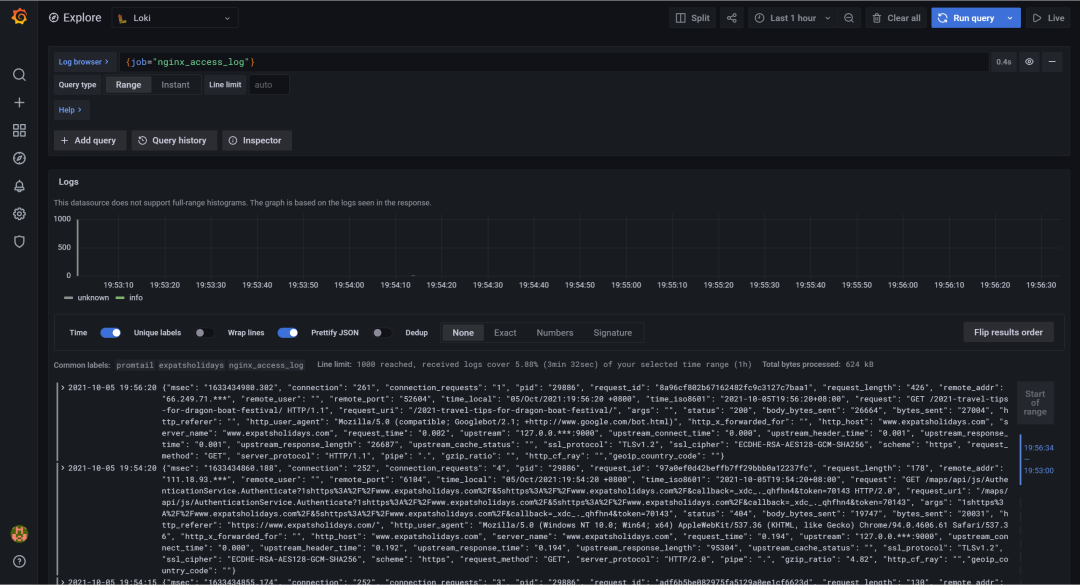
可以看到,日志已经存入loki。
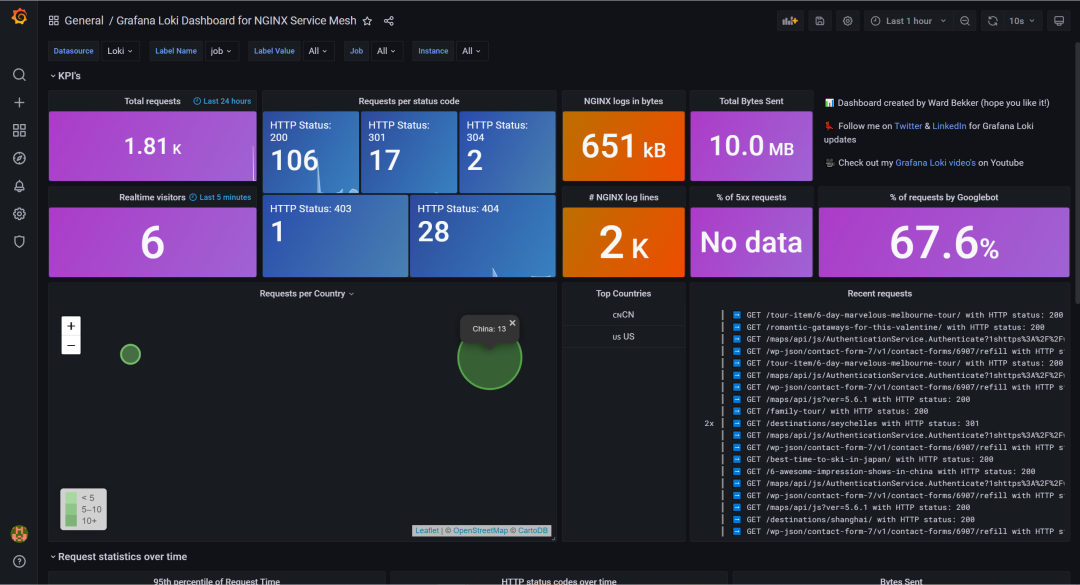
接着添加Dashboard,通过ID导入。

导入如下:
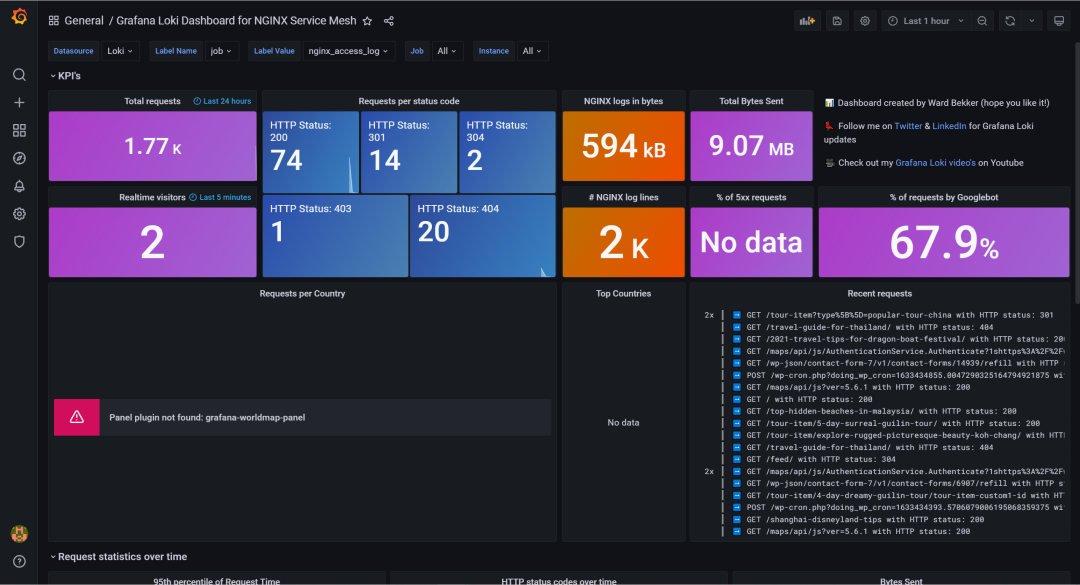
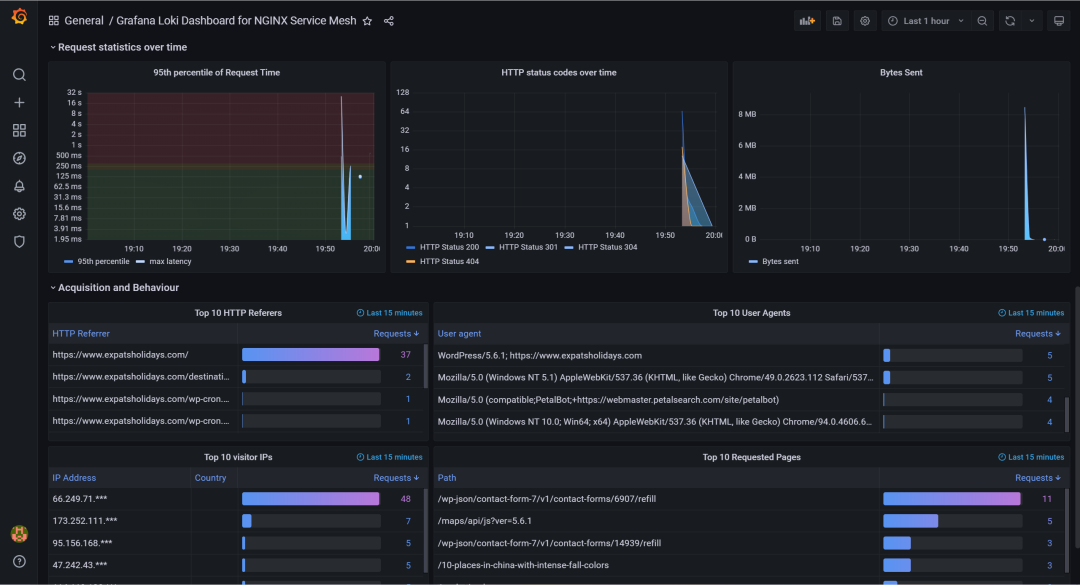
可以看到,这里地图没展示,缺少grafana-worldmap-panel插件,我们装一下,通过命令行:
grafana-cli plugins install grafana-worldmap-panel
安装完成后,重启grafana,重新查看dashboard。

地图可以展示,这里因为地图的地址是国外的地址,所以地图的图片无法加载,可以通过反代的方式解决。
ok,今天内容就这些,通过简单快速的方式,为客户呈现网站的详细访问情况,Loki+Grafana是绝佳的组合。


如果字段的最大可能长度超过255字节,那么长度值可能…
只能说作者太用心了,优秀
感谢详解
一般干个7-8年(即30岁左右),能做到年入40w-50w;有…
230721